![]() Click here to register for the live ETA demo!
Click here to register for the live ETA demo!
Contents:
- Process Overview
- ETA System Architecture
- Verb Language
- Relative Position Jumping (RPJ)
- Summarized Reporting
Process Overview
The ETA application supports all facets of test automation and reporting:
- The creation and retention of test plans and the automation of test cases.
- The creation and retention of execution tables defining devices or testbeds where test plans will be executed.
- The scheduling and execution of these test plans against one or more testbeds or devices defined in execution tables.
- The detailed reporting and logging of executions for easy review.
- Summarized reporting of execution results and resource usage.
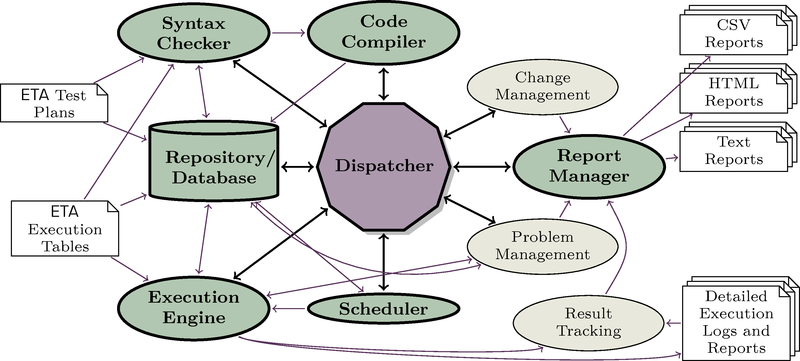
The figure below represents the various components, processes, and sub-systems of the ETA application. For further information on the planned availability of these sub-systems as well as other features, please contact your Etaliq Support representative.
Create/Import Test Plan
Create a test plan with any text editor and import into ETA database.
Execute Test Plan
Execute a test plan to occur immediately or set up a schedule all from within the ETA Client GUI.
Review Results
Review the detailed results or logs associated with any execution, which can be archived (baselines) or downloaded.
Summarized Reports
Create executions or node usage summary reports dynamically for forecasting and analysis. This useful tool aids in resource usage within the testing cycles and schedules.
Archive or Download Reports
Download text versions of detailed execution test plans, execution tables, reports, and logs for off database storage or move entire execution reports to archive.
ETA System Architecture
ETA (Easy Test Automation) is a test automation tool for testing any system or software supporting a text based command-line interface. Text based testing protocols that are used to communicate with these devices includes Telnet, TL1, SSH, SNMP, and various socket based communications protocols. In addition, ETA provides the ability to use various shell environments (Sh, Tcsh, Tclsh, etc.) and direct sockets (MySQL®, etc.) to communicate with the devices used for testing.
The ETA Automation Language is an efficient and flexible method used to automate SUTs and other vendor products used to test these systems. Examples of devices used in testing include traffic generators, session replicators, and capture/decode software/hardware.
ETA comprises the following sub-system elements:
- ETA Automation Language
- ETA Code Compiler
- ETA Syntax Checker
- ETA Execution Engine
- ETA Repository/Database
- ETA Scheduler
- ETA Report Manager
ETA Automation Language
The ETA Automation language is a 4th generation language, which is syntax checked and pre-compiled. ETA's reduced instruction set is written to make it quick and easy for anyone to automate tests. Test plans are written using any standard text editor or any off-the-shelf word processor that is capable of saving in a raw ASCII text format. ETA uses this version of test plan file as its source code.
ETA Syntax Checker
The first time a specific test plan/execution table combination is scheduled for execution, a Syntax Check is automatically performed. If desired, this check can be performed (or repeated) through the Scheduler interface.
The syntax checker is responsible for verifying the following:
- That resources required in the test plan are appropriately defined in the execution table
- That the test plan contains all mandatory markers denoting test plan, group and case sections, attributes, IDs, and definitions
- That the command syntax used for each command is according to syntax rules
- That declared lists, variables, flags, and named commands are correctly used in conjunction with other commands in the test plan
During the compilation step, hardware abstraction is applied throughout the test plan using the REPLACE commands contained therein. Hardware abstraction allows the same set of tests to execute against various nodes and hardware types without having to create entirely different test plans. An example of this is to REPLACE “Serial0/1” with “Ethernet2/2”, throughout the test plan. By applying this REPLACE command to a test plan prior to execution; the test executable will operate against the Ethernet2/2 port instead of the Serial0/1 port. This is one example of how ETA supports hardware abstraction.
ETA Execution Engine
The ETA Execution Engine uses the test plan file to run tests and completes the hardware abstraction routines to modify tests for hardware platform differences. Tests can execute against any node, slot, or port without having to be rewritten.
ETA Repository/Database
The ETA Repository/Database contains the following:
- All user information
- Test plans and their associated groups, cases, and attribute definitions, including previous versions
- All tables (i.e. exec, node, slot, card, and replace), including all of their versions
- All execution result files with all of their associated reports and logs
- All node usage statistics and execution results
ETA Scheduler
The ETA Scheduler starts executions as requested by the users. It also keeps track of what is currently running, to make sure that multiple executions do not attempt to use the same nodes at the same time. When executions are requested, it ensures that they have been pre-verified so that users will know, in advance, whether their executions will be able to run at the allotted time. In addition, it calculates future run times of recurring schedules.
ETA Report Manager
ETA Report Manager is responsible for the creation, the maintenance, and the archiving of the logs and reports associated with Executions. It also rolls up the results of multiple executions to provide summarized Execution Reports and tracks the usage of nodes by executions and manual lockouts to provide summarized Node Usage Reports.
Under Executions are reports for individual executions. Each references all the files involved in each execution. Further, each contains reports on all the details of the execution. The non-input-file reports are as follows:
- Attributes
- the execution metadata
- Syntax Report
- all the output of the parsing and compilation steps
- Detailed Report
- the complete output of the execution run
- Summary Report
- a short report with one line per test
- Console Log(s)
- the complete output from each node
Summarized Reporting is used to track results across many executions or to track resource usage over many days, weeks, or months. Summarized Execution Reports show how many test cases match certain constraints, broken down arbitrarily. (e.g. how many test cases PASSed each day this past week). Summarized Node Usage Reports show when nodes were used for manual or automated testing, and it can also be constrained or broken down by Node, User, or both.
Verb Language
ETA's unique verb language is so easy to use that the Subject Matter Expert (SME) can write the automation directly, using any text editor or word processor. It is no longer necessary to struggle with Tcl or Perl syntax, regular expression parsing constructs, or to deal with errors that only become apparent when running the scripted automation. ETA has completely simplified the process. There are only a few basic commands, which read like English. SMEs are up and running in a matter of a few hours.
The benefits to this approach are immediate and significant. By integrating the common language test plan and automation scripting phases, work-flow efficiency is taken to the next level: more tests, less miscommunication, and dramatically fewer bugs.
Here is an example of ETA at work:
  RESULTLIST(EXPECTED)
    "software version >= 3.4.1"
    "ASIC Hw Pkg      =  xLCv42f"
  SEND Node1 "display system info" EXPECTED
Automation is simply the repeating process of sending, receiving and verifying. The first command declares an expected result definition list named EXPECTED, which contains two expected attribute requirements: The SUT attribute “software version” must be greater than or equal to “3.4.1”, and the SUT attribute “ASIC Hw Pkg” must be equal to “xLCv42f”. The second command can be read as follows: SEND to Node1 the command “show system info” and verify that the response matches the EXPECTED result definition list.
Relative Position Jumping (RPJ)
This feature cross-links and references execution files to make examining reports easy. Output logs are referenced by time, input files by line number and the Detailed Report is reference by both. These cross-references speed up finding information relevant to a test failure, which aids in problem determination by shortening analysis time.
An example of this ability is when a user reviewing a Detailed Report observes an issue in the execution of a step at line 4000. To verify if there are problems on the console, the user selects that line and opens a console log by selecting its file tab. When the console log opens, the focus is on the line that was received by ETA when the step was executed.
When user returns to the Detailed Report, the focus will be on the original step i.e. line 4000. Then the user can open the test plan to see what the test was trying to accomplish at that time. When the test plan opens, the focus is on the source code describing the step that drove execution.
Relative Position Jumping is performed continuously from file to file in all of the ETA logs and reports. All output of nodes is linked together with the test plan and the different reports the moment ETA becomes aware of them. Note that this does not necessarily reflect the actual chronological order of events as ETA may not become aware of output from a node until the test case code instructs it to interact with that node.

Summarized Reporting
Summarized Reporting generates reports on execution performance and node usage. Reports are defined by choosing the attributes to include on the X- and Y-axes. The scope of the report is defined through Constraints. The result of the query is displayed as a table. Frequently used queries may be saved for easy access.
The Summarized Execution Reporting tool uses a table format to view statistics for completed executions. The report can be summarized by time, day, week, month, year, test plan, test case, verdict, duration, and more.
The Summarized Node Usage Reporting tool presents a simple table showing the utilization of the various nodes over the selected period of time. In particular, it is very useful for tracking the node usage of individual users.